Abercrombie & Fitch (ANF)
featuring Michael Kors (KORS)
Note: This analysis of ANF and KORS leans heavily on my personal stock screener.
Summary
Last weekend I took a look at Abercrombie & Fitch and Michael Kors with the aid of my stock screener.
Given ANF’s poor performance in recent history, I approached it as a case of mean reversion. ANF appears as relatively cheap to its peers, but is not “undervalued”, as defined by my screener. At $22.55 per share, ANF is still within its predicted valuation range of $18.48 to $70.05 per share.
Still, there are a few ways to invest based on the findings. First, you can write put options at a strike price outside of the predicted range. Second, you can simply wait and take advantage of a sudden pull back in the stock price.
KORS meanwhile appears “undervalued”. At a price of $50.78 per share, KORS falls well outside of its predicted range of $61.84 to $108.93 per share. This range is based on KORS’s current ROE of 42.1%.
It’s likely however that the market expects a coming decline in ROE. The market expectations derived from the screener show that KORS’s ROE will decline to somewhere between 14.9% to 31.9%, with a central prediction of 23%. This is a sharp drop from its historical average of 45.2%.
First Screen: Abercrombie & Fitch
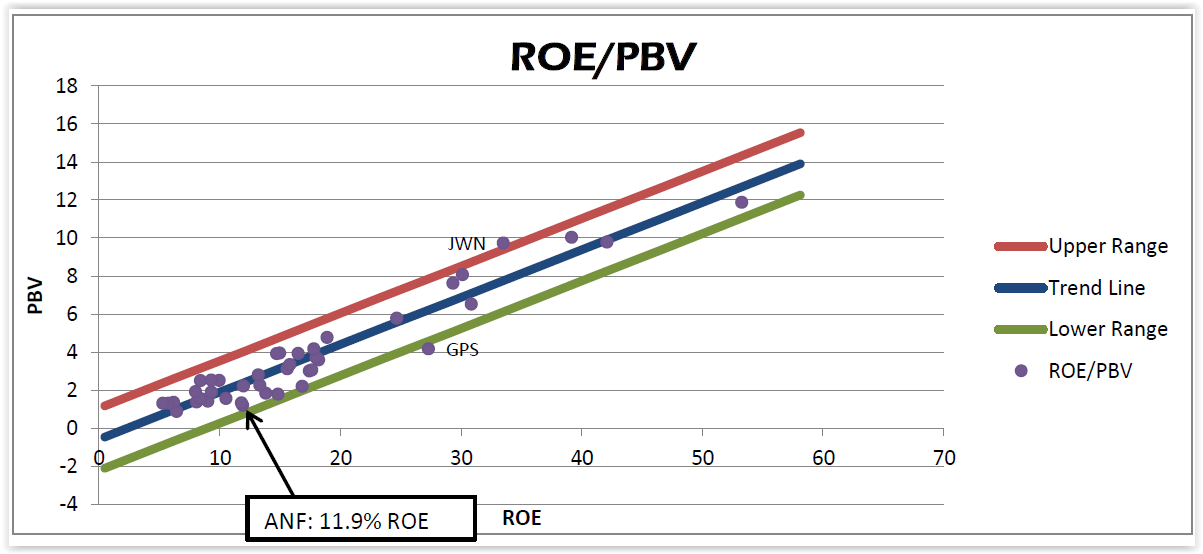
To determine if Abercrombie & Fitch (ANF) is currently “undervalued”, I utilized the aid of my personal stock screener. For this screen the pairing multiple of Return on Equity and Price to Book is used. The regression made on ANF and its peers results in a rather high R^2 of 0.92.
Brief explanation: The stock screener uses a simple linear regression to find “Undervalued” stocks. An “Undervalued” stock, as defined by the screener, is any stock that fall two standard errors below the regression line. An “Undervalued” stock in this context is assumed to provide a statistical margin of safety.
As seen in the regression below, ANF falls just slightly above the blue trend line. This indicates that ANF is trading slightly above fair value. But when we consider the inputs used in this screen, it becomes clear that there’s a problem that needs to be addressed.
Note: Any stock that falls outside of the “regression channel” created by the red and blue lines can be considered mis-priced by the market.
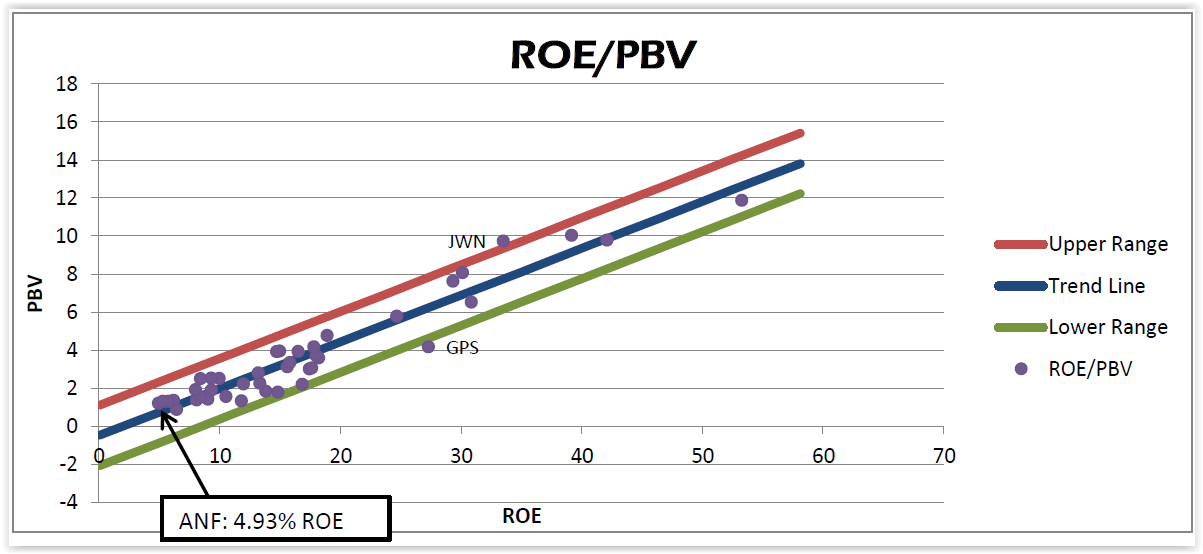
Note: The peer companies included in the screen were; related in nature, dividend paying, with a market cap greater than $100 million, and an ROE between 0% and 60%.
ROE Problem
This first screen used the trailing 12 month Return on Equity data from Yahoo Finance. This creates a problem in two ways:
- First: Using a single period ROE has the implicit assumption that financial performance of a company is rather consistent from year to year. This assumption may be reasonable for a company like Coca-Colca, but Abercrombie & Fitch has too much fluctuation in its business to make use of a single period ROE.
- Second: Using a depressed ROE in the screen will result in a stock appearing as more expensive than it truly is. Given ANF’s recent poor financial performance, it will experience this form of screening bias.
The alternative to using a trailing 12 month figure is to use a historical average which we will look at next.
Mean Reversion
In forecasting the future, there are often two paths one can take; extrapolation of current trends, or mean reversion. As just discussed, the trailing 12 month figure is based on extrapolating the present while a historical average is based on mean reversion.
In his book, “Deep Value”, author Tobias Carlisle explains that the process of extrapolation feels natural to the human mind, but is often misleading. We instinctively want to reward good companies and punish bad ones. But as we carry this out, we become blind to one of the most powerful elements in investing; Mean reversion.
Among Carlisle’s counterintuitive insights includes this quote;
“Stocks with big market price losses and historically declining earnings tend to see their earnings grow faster, and outperform the market.” Meanwhile, “Stocks with big market price gains and historically high rates of earnings growth tend to grow earnings more slowly in the future, and underperform the market.”
Carlisle explains, “The better bet is the counterintuitive one: deep undervaluation anticipating mean reversion.” Consequently, given Abercrombie’s poor recent history, I thought it appropriate to look at ANF as a mean reversion candidate. This leads me to the second screen.
Second Screen: Abercrombie & Fitch
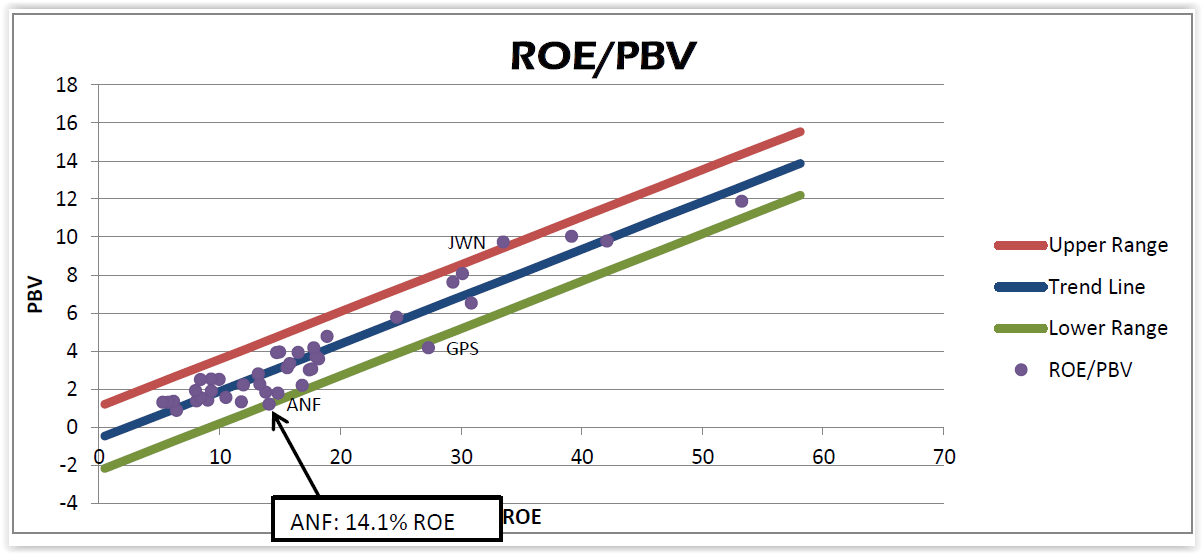
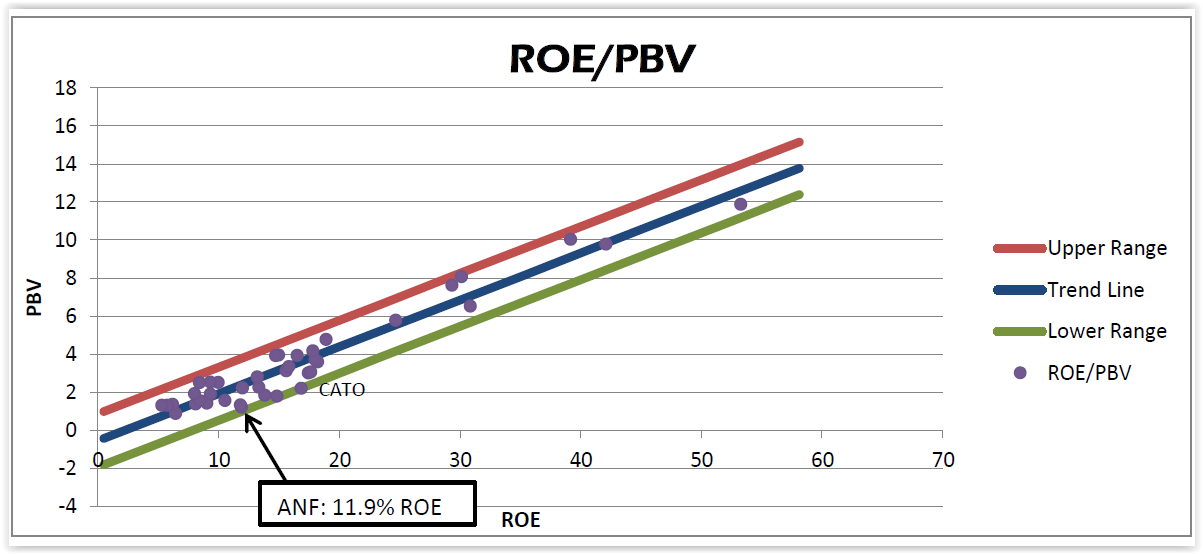
To account for mean reversion, I made the simple assumption that ANF will mean revert to its 10 year average ROE. Using Morningstar data, I calculated ANF’s 10 year average ROE as 11.9%. Using this new ROE for ANF, I re-ran the original screen.
In this new screen, ANF goes from being mildly overvalued to one of the cheapest stocks. Despite this move, AFN is still not “undervalued”. Thus we cannot reject the hypothesis that the market has mis-priced AFN.
Note: In the following graph notice that ANF has shifted closer to the lower green line, but has not crossed.
Solving for X
Through the use of the stock screener, we have concluded that although ANF may appear relatively cheap, it is not undervalued. Now we move on to answer three important question:
- ROE: At what ROE is ANF undervalued?
- Price: At what price is ANF undervalued?
- Profit: Can we profit from this today?
1. ROE: At what ROE is ANF undervalued?
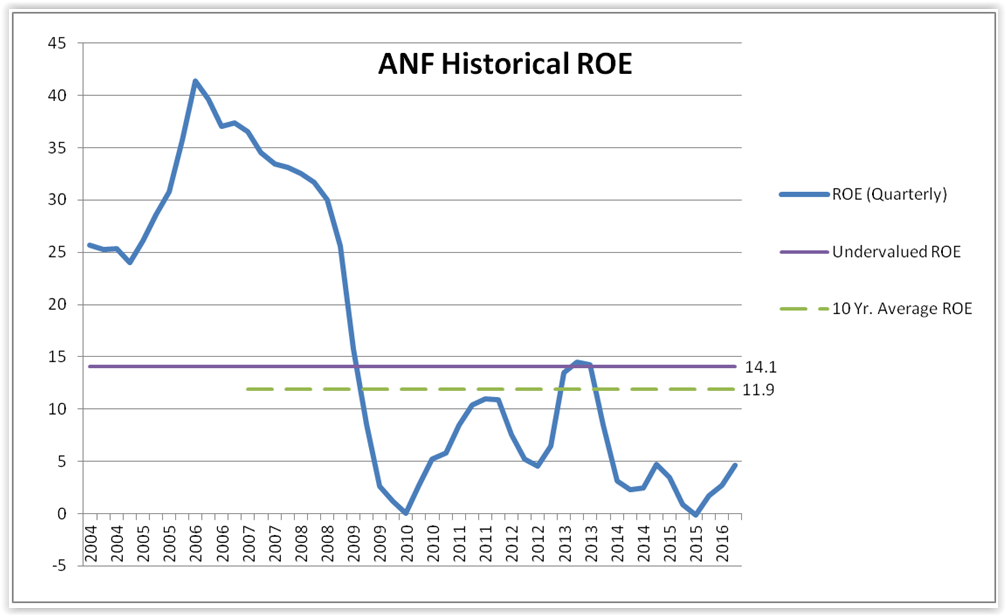
Given ANF’s current Price to Book Value, I want to know what ROE assumption would make ANF undervalued today. We will call this ROE the “Undervalued ROE”. Within the regression, the “Undervalued ROE” is the lowest expected ROE where ANF drops out of the regression range and becomes undervalued at today’s price.
As seen in the graph below, it’s found that that ANF’s “Undervalued ROE” is 14.1%. Meaning that if we believe ANF will earn an ROE greater than or equal to 14.1% moving forward that we should invest today.
It might be tempting to convince ourselves that ANF can achieve a 14.1% ROE moving forward. Especially after looking at ANF’s ROE from 2004 to 2009. Or after considering that the median ROE of companies in the screen is 14.8%. But there are three reasons to be cautious about expecting a 14.1% ROE moving forward.
First: ANF only averaged an 11.9% ROE for the past ten years.
Second: The last time ANF’s Fiscal Year ROE exceed 14.1% was 2009. It was 15.72%.
Third: High long-term ROE is achieved by businesses that build wide and durable competitive moats, and then rigorously maintain them. In my cursory readings of ANF’s 10k, moat building did not appear high in their priorities for the past 7 years. Rather their plans for the future were largely based in making a swift return to the past. i.e. Their chief focus was restoring gross and operating margins to historical levels through cost cutting.
It’s challenging to expect ANF to enjoy great returns when they haven’t laid the ground work. This reminds me of a quote I read in the WSJ about Yahoo recently, “What Yahoo is going through today is not because of decisions they made three years ago. It’s because of decisions they made 10 years ago.”
2. Price: At what price is ANF undervalued?
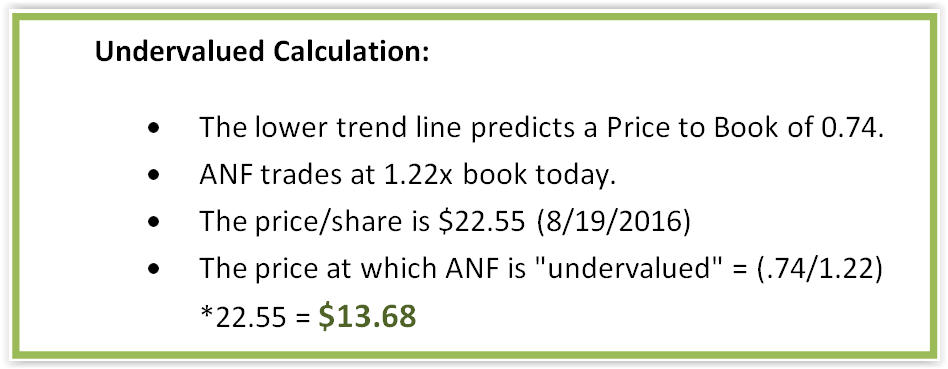
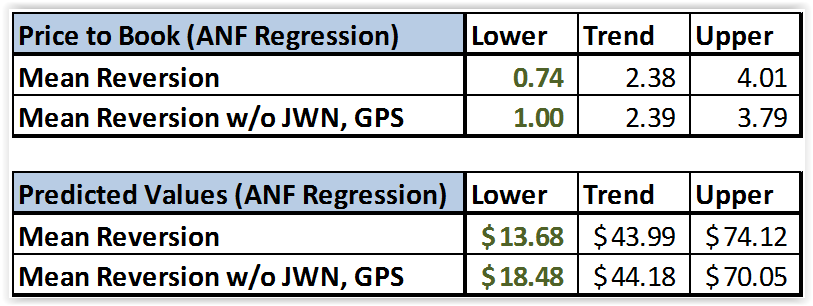
Using the earlier mean reversion screen (which assumed an 11.9% ROE), we can find the share price at which ANF is undervalued. This price is $13.68, which is a 39% discount from its close of $22.55 on Friday (08/19/2016).
Before moving on however, I’d actually like to refine this regression a little further. In the “mean reversion screen” conducted earlier, JWN and GPS appeared as Over and Under-valued respectively. This tends to exact a significant influence on the regression. Sometimes it can prove to be quite informative to remove them, which is what I did in the chart below.
Once removed, the predicted PBV of the lower trend line moves from 0.76 to 1.00. This results in an undervalued price of $18.48, or an 18.05% discount from the current share price.
The Price to Book trend data and predicted values for both screens are show below. Notice that the screen gives you the price at which a stock is undervalued (Lower), fairly valued (Trend), and Overvalued (Upper). This feature can assist with both buying and selling decisions.
Note: Not all stocks that appear as under or over-valued within the screen are indeed good or bad investments. There are quantitative and qualitative elements which the screen misses. The screen is generally meant to be an aid which is best used in unison with an investor’s knowledge, insight, and research .
3. Profit: Can we profit from this today?
While ANF’s share price does not provide that statistical margin of safety that we require, there are still a few way to implement these findings today.
Write Put Options: An alternative strategy to invest in ANF is to sell put options with an exercise price near or below the “undervalued” price.
For example, one could sell a January 2017 put option with a $19 strike price and take in a $1.70 premium. Then, if you get put the shares at expiration, you’d effectively be buying them for $17.30. Well below the undervalued price of $18.48 per share.
Wait: Understanding the range where ANF is undervalued, we can opportunistically use this information if stock price should decline. But periodic updating of the screen results will be necessary.
Recap: Abercrombie & Fitch
The regression analysis found that ANF is not currently “undervalued” at its Friday close price of $22.55. Rather you may say it becomes undervalued somewhere below 18.48. But that’s ok. It’s still possible to wait and buy ANF if it becomes undervalued. Additionally, it is possible to write uncovered put options with a strike near or below the undervalued price and benefit accordingly.
Michael Kors
Note that when I ran the ANF screen earlier, I excluded all non-dividend paying stocks. This meant that stocks like Michael Kors (KORS) did not appear. So after I finished, I doubled back and ran another screen to include these non-dividend paying stocks.
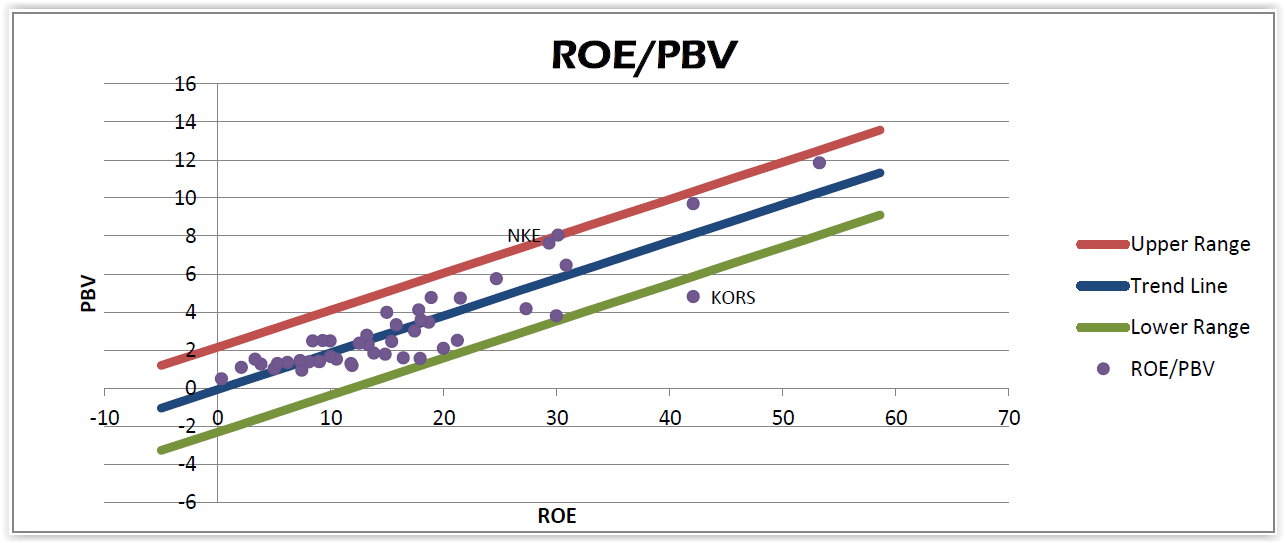
The result: Michael Kors appears as undervalued. In the screen below, KORS appears significantly below the lower green trend line. This means that we can reject the hypothesis that KORS is fairly valued given a 42.09% ROE.
The lowest valuation that is justified by the regression is $61.84 per share, which is an 18% discount from its current share price of $50.78. In fact, the regression predicts a valuation range for KORS of $61.84-$108.93.
These predicted values are contingent upon KORS’s future returns on equity resembling its past. The market on the other hand, likely believes the future will be worse. Exactly how much worse is what I want to know. For that, we can go back to the screen.
Earlier, we found the “Undervalued ROE” that would make ANF fall outside of the “regression channel”. This time, we want to find the range of ROE’s that would make KORS fall within the “regression channel”.
Doing this we find the that the market expects a future ROE in the range of 14.9% to 31.9%, as shown above. This is in contrast to KORS’ historical ROE of 45.2% and trailing 12 months ROE of 42.1%. This implies that if an investor expects Michael Kors’s future ROE to resemble the past, or be higher than 31.9%, then KORS offers considerable value at today’s price of $50.78 per share.
Discover more from Latticework Investing
Subscribe to get the latest posts sent to your email.

